 Democrats and the their dedicated media team labeled Donald Trump a racist as soon as he announced his campaign for President in 2015. But all Republicans face the same charge, so it wasn’t particularly noteworthy.
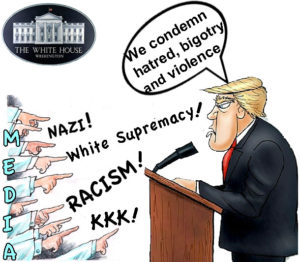
But after the August 12 Charlottesville riots there was greater intensity with politicians and media figures ceaselessly accusing him of personal bigotry, condoning white supremacists and seeking votes from Nazis.
The President made several statements starting with this on the day of the riots:
We’re closely following the terrible events unfolding in Charlottesville. We condemn in the strongest possible terms this egregious display of hatred, bigotry and violence on many sides, on many sides. It’s been going on for a long time in our country […]What is vital now is a swift restoration of law and order and the protection of innocent lives
If any other President or elected official had said the same thing it would have drawn little attention, beyond perfunctory acknowledgement between video clips of the rioters. But Trump is different. He has attracted a thundering herd of spiteful critics and they erupted in sanctimonious indignation, objecting to “many sides,” even though elements other than the racists had expressed hatred and had initiated violence. They skewered him for not naming the racist groups.
So, two days later he issued another statement that included,
Racism is evil. And those who cause violence in its name are criminals and thugs, including the K.K.K., neo-Nazis, white supremacists and other hate groups that are repugnant to everything we hold dear as Americans.
The herd interpreted this response to their demands as weakness they could exploit, and they escalated, denouncing Trump for still insufficient condemnation of racism.
The following day, August 15, was a White House Press event about infrastructure. But the reporters were not interested in infrastructure and they were openly hostile.
Even though their own video showed elements within the counter protesters who call themselves “antifa,” wearing black hoods and masks and carrying clubs had initiated force against the racists who had also initiated force, the reporters acted as if acknowledging violence on both sides was beyond civilized boundaries.
[UPDATE: In recent days some Democrats have grudgingly begun to agree with Trump about antifa.]
The media herd told us that Trump had revealed “what’s in his heart” to be acceptance of racism or sympathy for racists or a desire for the votes of racists, or something.
None of us can know for certain what’s in anyone’s heart but our own. But we can consider strong evidence of what actually is in the President’s heart regarding race relations.
Let’s start with an excerpt from his Inaugural Address back in January. This is what he chose to include in what was until that moment, the most important speech of his life, one he had spent more than two months preparing:
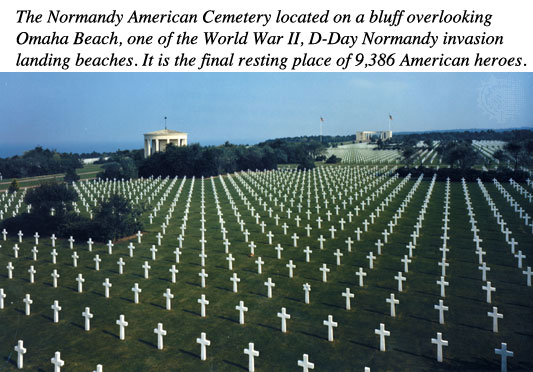
It is time to remember that old wisdom our soldiers will never forget: that whether we are black or brown or white, we all bleed the same red blood of patriots, we all enjoy the same glorious freedoms, and we all salute the same great American Flag.
The President didn’t serve but he has surrounded himself with people who did and apparently has gained a profound insight from military culture. I served in the Army and I immediately identified with this part of Trump’s speech.
Service in the American military is a genuine melting pot experience. It’s total immersion in an ethnic Jambalaya. The Census Bureau recognizes six races, plus numerous mixed races in America. No matter which one you represent, if you become a Marine, Sailor, Airman or Soldier, you WILL train with, live 24/7 with, and overcome challenges and adversity shoulder to shoulder with people from all the others. You will join the tradition of Duty, Honor and commitment to country. Your duty includes looking out for, and protect each other.
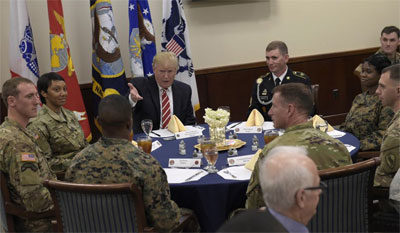 Indeed, of military necessity as well as human decency, trainees are immersed in a culture that epitomizes America’s founding motto, E pluribus unum – out of many one.
Even if one brings racial prejudice with him/her into boot camp it soon fades away. I know. I saw it happen in my own basic training company, nearly five decades ago when transparent racial animus was more prevalent and less universally condemned than today. Anyone who is sincerely interested in a future America without racial biases or divisions would do well to study the military example.
But those on the Left who gain media attention, or income, or votes from inflaming and exploiting racial discord do NOT hope for an America that works more like the military.
The Left has nurtured and refined “identity politics,” which is segmenting us by race and/or gender and targeting the segments with political messages designed to promote fear, resentment and suspicion of the other segments.
To understand how thoroughly the Left has entrenched identity politics, review establishment media reporting during the 2016 campaign. Over and over we heard that polling results reflected campaign messaging targeting racial and gender groups: the black vote, the woman vote, the white vote, the Hispanic vote, etc.
American election campaigns are mostly about how government impacts the economy, which, in turn impacts all Americans, regardless of ethnicity or gender. If Trump is right, that changing international trade agreements will generate more economic opportunity then we will all benefit, regardless of race or gender. Yet the Left’s cynical proclamation was that Trump favored white men and a Trump Presidency would be designed to benefit only white men at the expense of women and ethnic minorities.
President Trump reiterated his racial unity theme at the beginning of his August 21 address to the nation regarding future military strategy in Afghanistan with more appeals to military style unity:
Since the founding of our republic, our country has produced a special class of heroes whose selflessness, courage, and resolve is unmatched in human history.
[…]
They transcend every line of race, ethnicity, creed, and color to serve together — and sacrifice together — in absolutely perfect cohesion. That is because all service members are brothers and sisters. They’re all part of the same family; it’s called the American family. They take the same oath, fight for the same flag, and live according to the same law. They are bound together by common purpose, mutual trust, and selfless devotion to our nation and to each other.
The soldier understands what we, as a nation, too often forget that a wound inflicted upon a single member of our community is a wound inflicted upon us all. When one part of America hurts, we all hurt. And when one citizen suffers an injustice, we all suffer together.
What refreshing language this is! As a certified “senior citizen” I remember a time when most politicians of both parties and all ethnicities invoked themes of racial unity. What a stark contrast from today’s Democrats who constantly identify, emphasize and exploit distinctions, always warning that “people of color” and women will suffer direct attacks if Republicans win the next election. More from President Trump:
Loyalty to our nation demands loyalty to one another. Love for America requires love for all of its people. When we open our hearts to patriotism, there is no room for prejudice, no place for bigotry, and no tolerance for hate.
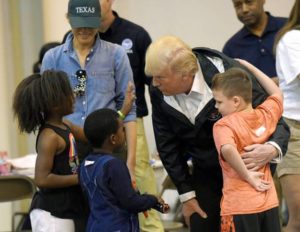 The opposite of these thoughts is today’s dominant political-media narrative, exploited by news channels, by Hollywood entertainers, by assorted grifters for profit, and by politicians for votes. They scorn patriotism. They accuse tens of millions of decent people of being motivated by racial hostility, because they vote against Democrats, or blow off absurd, politically correct speech codes and thought control. But millions of us, representing all races, do work together, play together and worship together. As we saw in the wake of Hurricanes Harvey and Irma, we help each other in times of crisis without regard to race.
So what should our national goal be? Our history of slavery, segregation and cruel Jim Crow laws can not be denied. We do not have the power to change it or erase its scars. We have only the power to influence our present and future national culture. Will we chose the America President Trump advocates, that is more like the military culture with unity of purpose and without racial acrimony? Or, will we let rancorous politicians and activists impose their vision of an America where people who want to get along with everyone are met with contempt and derision?
I had the privilege of living in the military culture for a few years and I’d like to see all Americans experience the benefits I gained from an environment where racial harmony prevails.
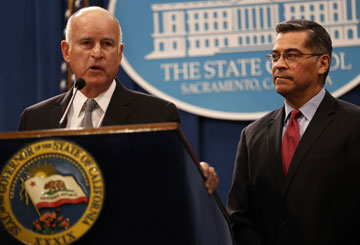 On March 8 Mr. Sessions filed a lawsuit, asking the federal court to block enforcement of three California laws whose purpose is to hinder enforcement of US immigration law. California Governor Brown, State Attorney General Becerra reacted with strident denunciation of Sessions and President Trump.
 Throughout this journey with this new administration we are navigating the complicated power relationship between local, state and federal governments. That’s part of the beauty of our Constitution. That’s part of the beauty of our democratic form of government. Mine is one of the many voices in that debate and I feel confident that the court system, which now has this case, is going to help us see some clarity.
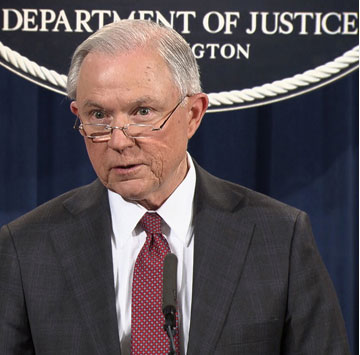 Jeff Sessions, Attorney General and leader of the Department of Justice, has suffered a lot of criticism, more from President Trump and Republicans than from Democrats. They are disappointed because he has recused himself and has been silent and passive regarding investigation of several urgent, high-profile matters including:
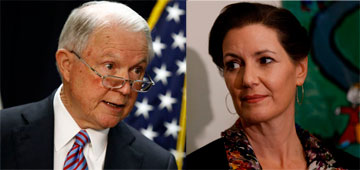
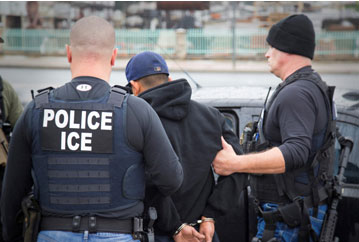 ICE Acting Director Thomas Homan announced that Mayor Schaaf’s warning helped hundreds of targets of this operation to evade capture. He has turned the matter over to the Justice Department for possible prosecution. The White House also announced that Justice was considering prosecution.
 The Trump/GOP victory is an
 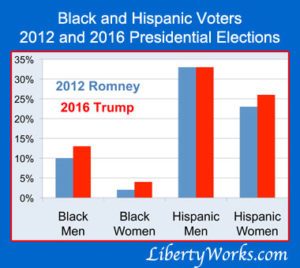 But, Trump and the Republicans won anyway!
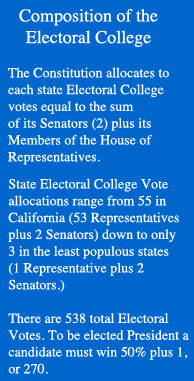 We can complete Step one right now. It takes us to the Electoral College system. To ensure the outcome of a Presidential election the Russians would have to do something to alter the Electoral College score, which all the “experts” told us was locked in for Hillary. Remember how often we we were told that Trump had “no path to 270,” the minimum number of Electoral College votes to win?
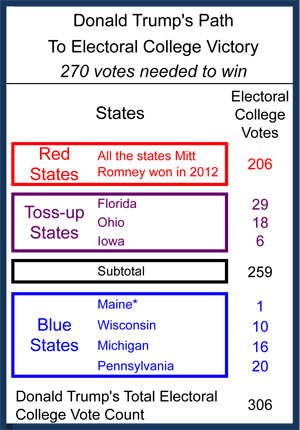
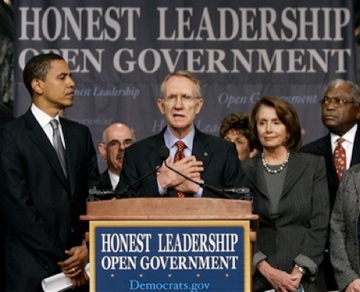 The fact that all three of these aristocrats of The Swamp so quickly agreed to something should make the rest of us immediately suspicious, knowing as we do that Swampys usually take care of their own, regardless of party.